Miha Gasper
Multiversatile Artist
The Meanings of Water Lilies
I had to create an Infographics about waterlilies, the flowers of July. I chose to portray them graphically in different colors with explanations (meanings, symbolism) of each color. To make things more interesting I also added a public-domain image of a nymph among the colorful flowers, asking them about their meanings. Why nymph?
The Latin name for waterlilies is Nymphaeaceae (nymphs). Clever, huh?
Here is the result: https://plaza.rakuten.co.jp/didyouknow/diary/202308150000/
What do you think about the end result? Should I stay at the more conservative presentation (like a table or something)?
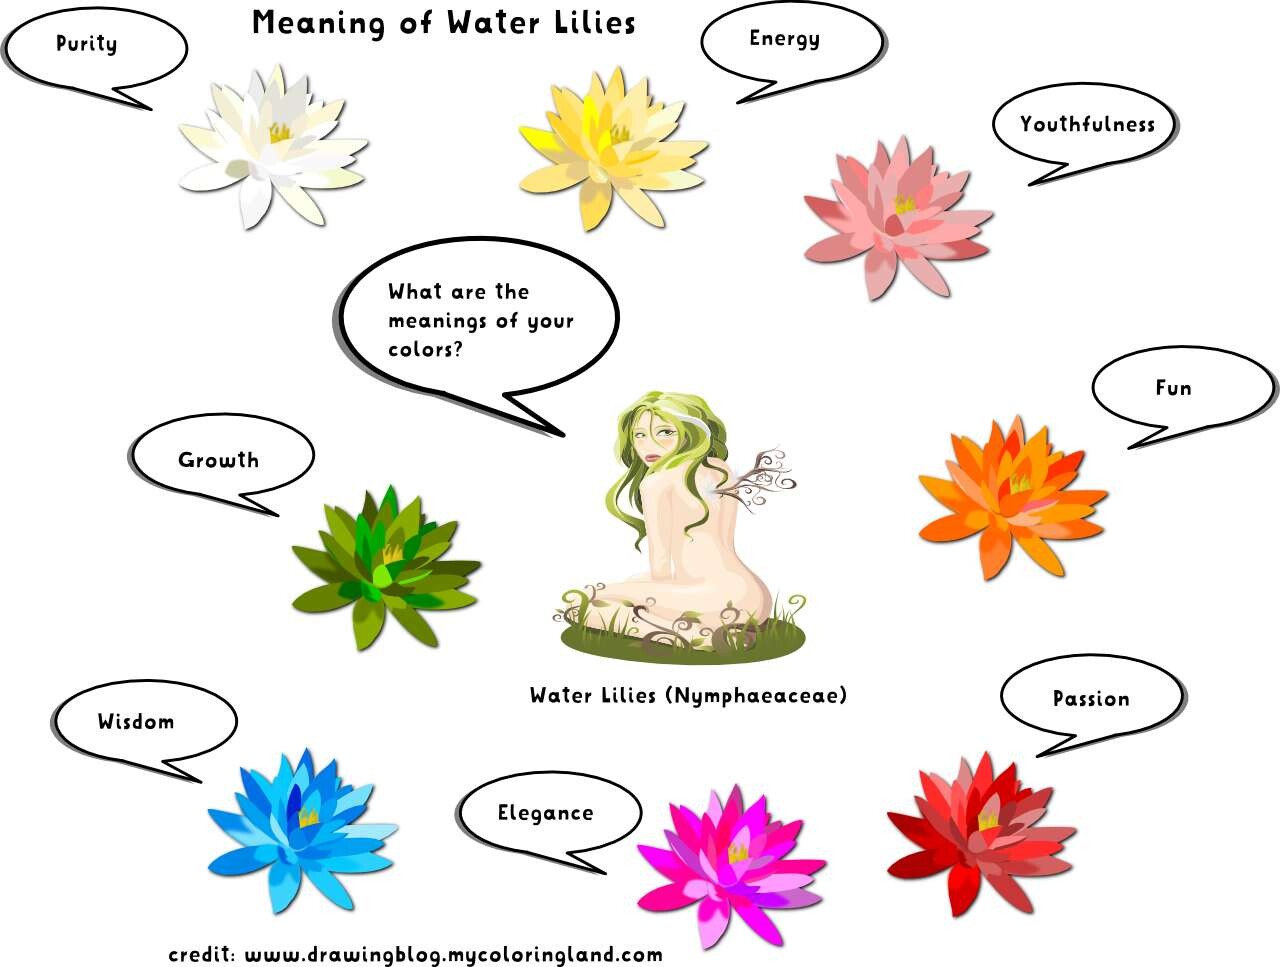
Symbolic meanings of water lilies by color